Development Roast Giving international development a proper roasting

By: Luis Carlos Jemio Ph.D.*
In October 2025, the National Institute of Statistics (INE) presented the updated national accounts for the country, a project that received technical support from ECLAC and the IMF. The new series of national accounts published by the INE includes significant methodological changes. First, the previous fixed-base GDP calculation system, which used 1990 as the base year for calculating GDP at constant prices, has been replaced by the chained variable-base system, the most widely used system in the world. Second, the INE undertook a significant statistical effort to calculate the updated national accounts, resulting in broader coverage of the national economy, including activities previously excluded from the calculation.
This new series of national accounts has resulted in a redefinition of the size of the economy, and therefore changes in the value of several commonly used macroeconomic variables and indicators, relative to their values calculated using the 1990 fixed-base GDP series, such as: GDP level, GDP per capita, GDP growth, fiscal deficit, public debt, etc. The following sections analyze some of the effects of the change in the national accounts series on these variables and indicators.
Nominal GDP and GDP per capita
As mentioned earlier, the calculation of the new national accounts series represents a significant statistical effort by the INE, which allowed for the inclusion of activities previously excluded from GDP calculations. As a result of this broader coverage, nominal GDP increased between 15% and 20% compared to the values in the previous series. Thus, nominal GDP in 2024 reached US$54,487 million (using the official exchange rate for this calculation), 17.7% higher than the value calculated using the previous fixed-base methodology.
Nominal GDP
(millions US$)

Source: Prepared based on information from the INE
As a result of the change in the nominal value of GDP, there has also been a change in Bolivia’s GDP per capita. Using the previous series, GDP per capita for 2024 reached US$4,073 per inhabitant, while with the new series it stands at US$4,794 per inhabitant (17.7% higher).
GDP per capita 2024
(US$ per inhabitant)

Source: Prepared based on information from the INE
GDP growth
Another indicator that has varied with the methodological change in the calculation of national accounts is the real GDP growth rate. There are differences in the formula for calculating the GDP growth rate between the two methodologies:
a.In the fixed-base system, which in the case of Bolivia’s national accounts was 1990, the formula used is:
 b.In the chained series system, the formula used is:

Where:
gbft : GDP growth rate for year t, relative to year t-1, fixed base system
gset: GDP growth rate for year t relative to year t-1, chained series system
P0 : prices from base year 0 (year 1990 in the case of Bolivia)
Pt—1: prices for year t-1
Qt : quantities produced in period t
Qt—1 : quantities produced in period t-1
Real GDP growth
(annual % change)

Source: Prepared based on information from the INE
There are some noteworthy aspects to consider when examining the two GDP growth series. First, it is striking that the GDP decline in 2020, as a result of the COVID-19 pandemic, is significantly higher when calculated using the new methodology (-12.72%) compared to the previous methodology (-8.7%). Conversely, the GDP growth rate in 2021, resulting from the economic recovery from the pandemic’s effects, is also considerably higher when calculated using the new methodology (10.03%) compared to the fixed-base methodology (6.11%). This is due to the greater weight of the sectors that experienced the largest declines during the pandemic (services and construction) in GDP.
Another striking aspect is that, with the new methodology, a GDP decline had already occurred in 2024 (-1.12%), which was not the case when growth was calculated using the previous methodology (0.73%). This shows that the economy was already in recession in 2024, registering negative growth rates for two consecutive quarters. This is also due to the greater weight of extractive activities in GDP today, which experienced the largest declines in 2024 and 2025.
Fiscal Deficit and Public Debt
Finally, other indicators that also changed when calculated using the new GDP series are the fiscal deficit and public debt. Since nominal GDP is higher when calculated with the new methodology, the fiscal deficit is lower as a percentage of GDP. As can be seen in the following graph, the deficit for 2024, which reached 10.2% of GDP when calculated using the nominal GDP of the 1990 fixed-base series, is reduced to 8.7% of GDP with the GDP of the new series. This does not mean, of course, that the country’s fiscal situation is less critical, but rather that the analysis of this and other economic issues must be adjusted to these new values for these indicators, since fiscal targets and rules are usually set as a percentage of GDP.
SPNF deficit
(percentage of GDP)

Source: Prepared based on information from the MEFP and INE
Another indicator closely linked to the previous one is the debt-to-GDP ratio. This is a key indicator for assessing the sustainability of public debt, as an upward trend in this indicator would show that the debt is on an unsustainable trajectory. Conversely, if this ratio remains stable or tends to decrease, the debt would be in a sustainable situation. This indicator is usually included as a target in the fiscal rules and fiscal responsibility laws that countries adopt to ensure fiscal sustainability.
As can be seen in the following graph, the debt-to-GDP ratio reached 82.0% of GDP in 2024, using the GDP from the previous fixed-base series, while with the new series, the ratio falls to 69.7% of GDP. Again, this change does not mean that the sustainability of public debt in Bolivia has improved, but rather that this issue should be analyzed considering these new values for this indicator.
Public Debt
(percentage of GDP)

Source: Prepared based on information from MEFP, BCB and INE
In summary, the new series of national accounts recently published by the represents a significant methodological advance, as it places Bolivia among the countries using this new system, which is employed in most countries. Furthermore, an effort has been made to broaden the coverage of the accounts to include a larger share of economic activities, leading to a redefinition of the size of the economy and GDP. This, of course, has modified the values of some variables and indicators commonly used in economic analysis and evaluation.
* Senior Researcher at INESAD, ljemio@inesad.edu.bo
This blog is part of the ADÁMAS ECONÓMICO Project.
The views expressed in the blog are those of the authors and do not necessarily reflect the position of their institutions or INESAD.


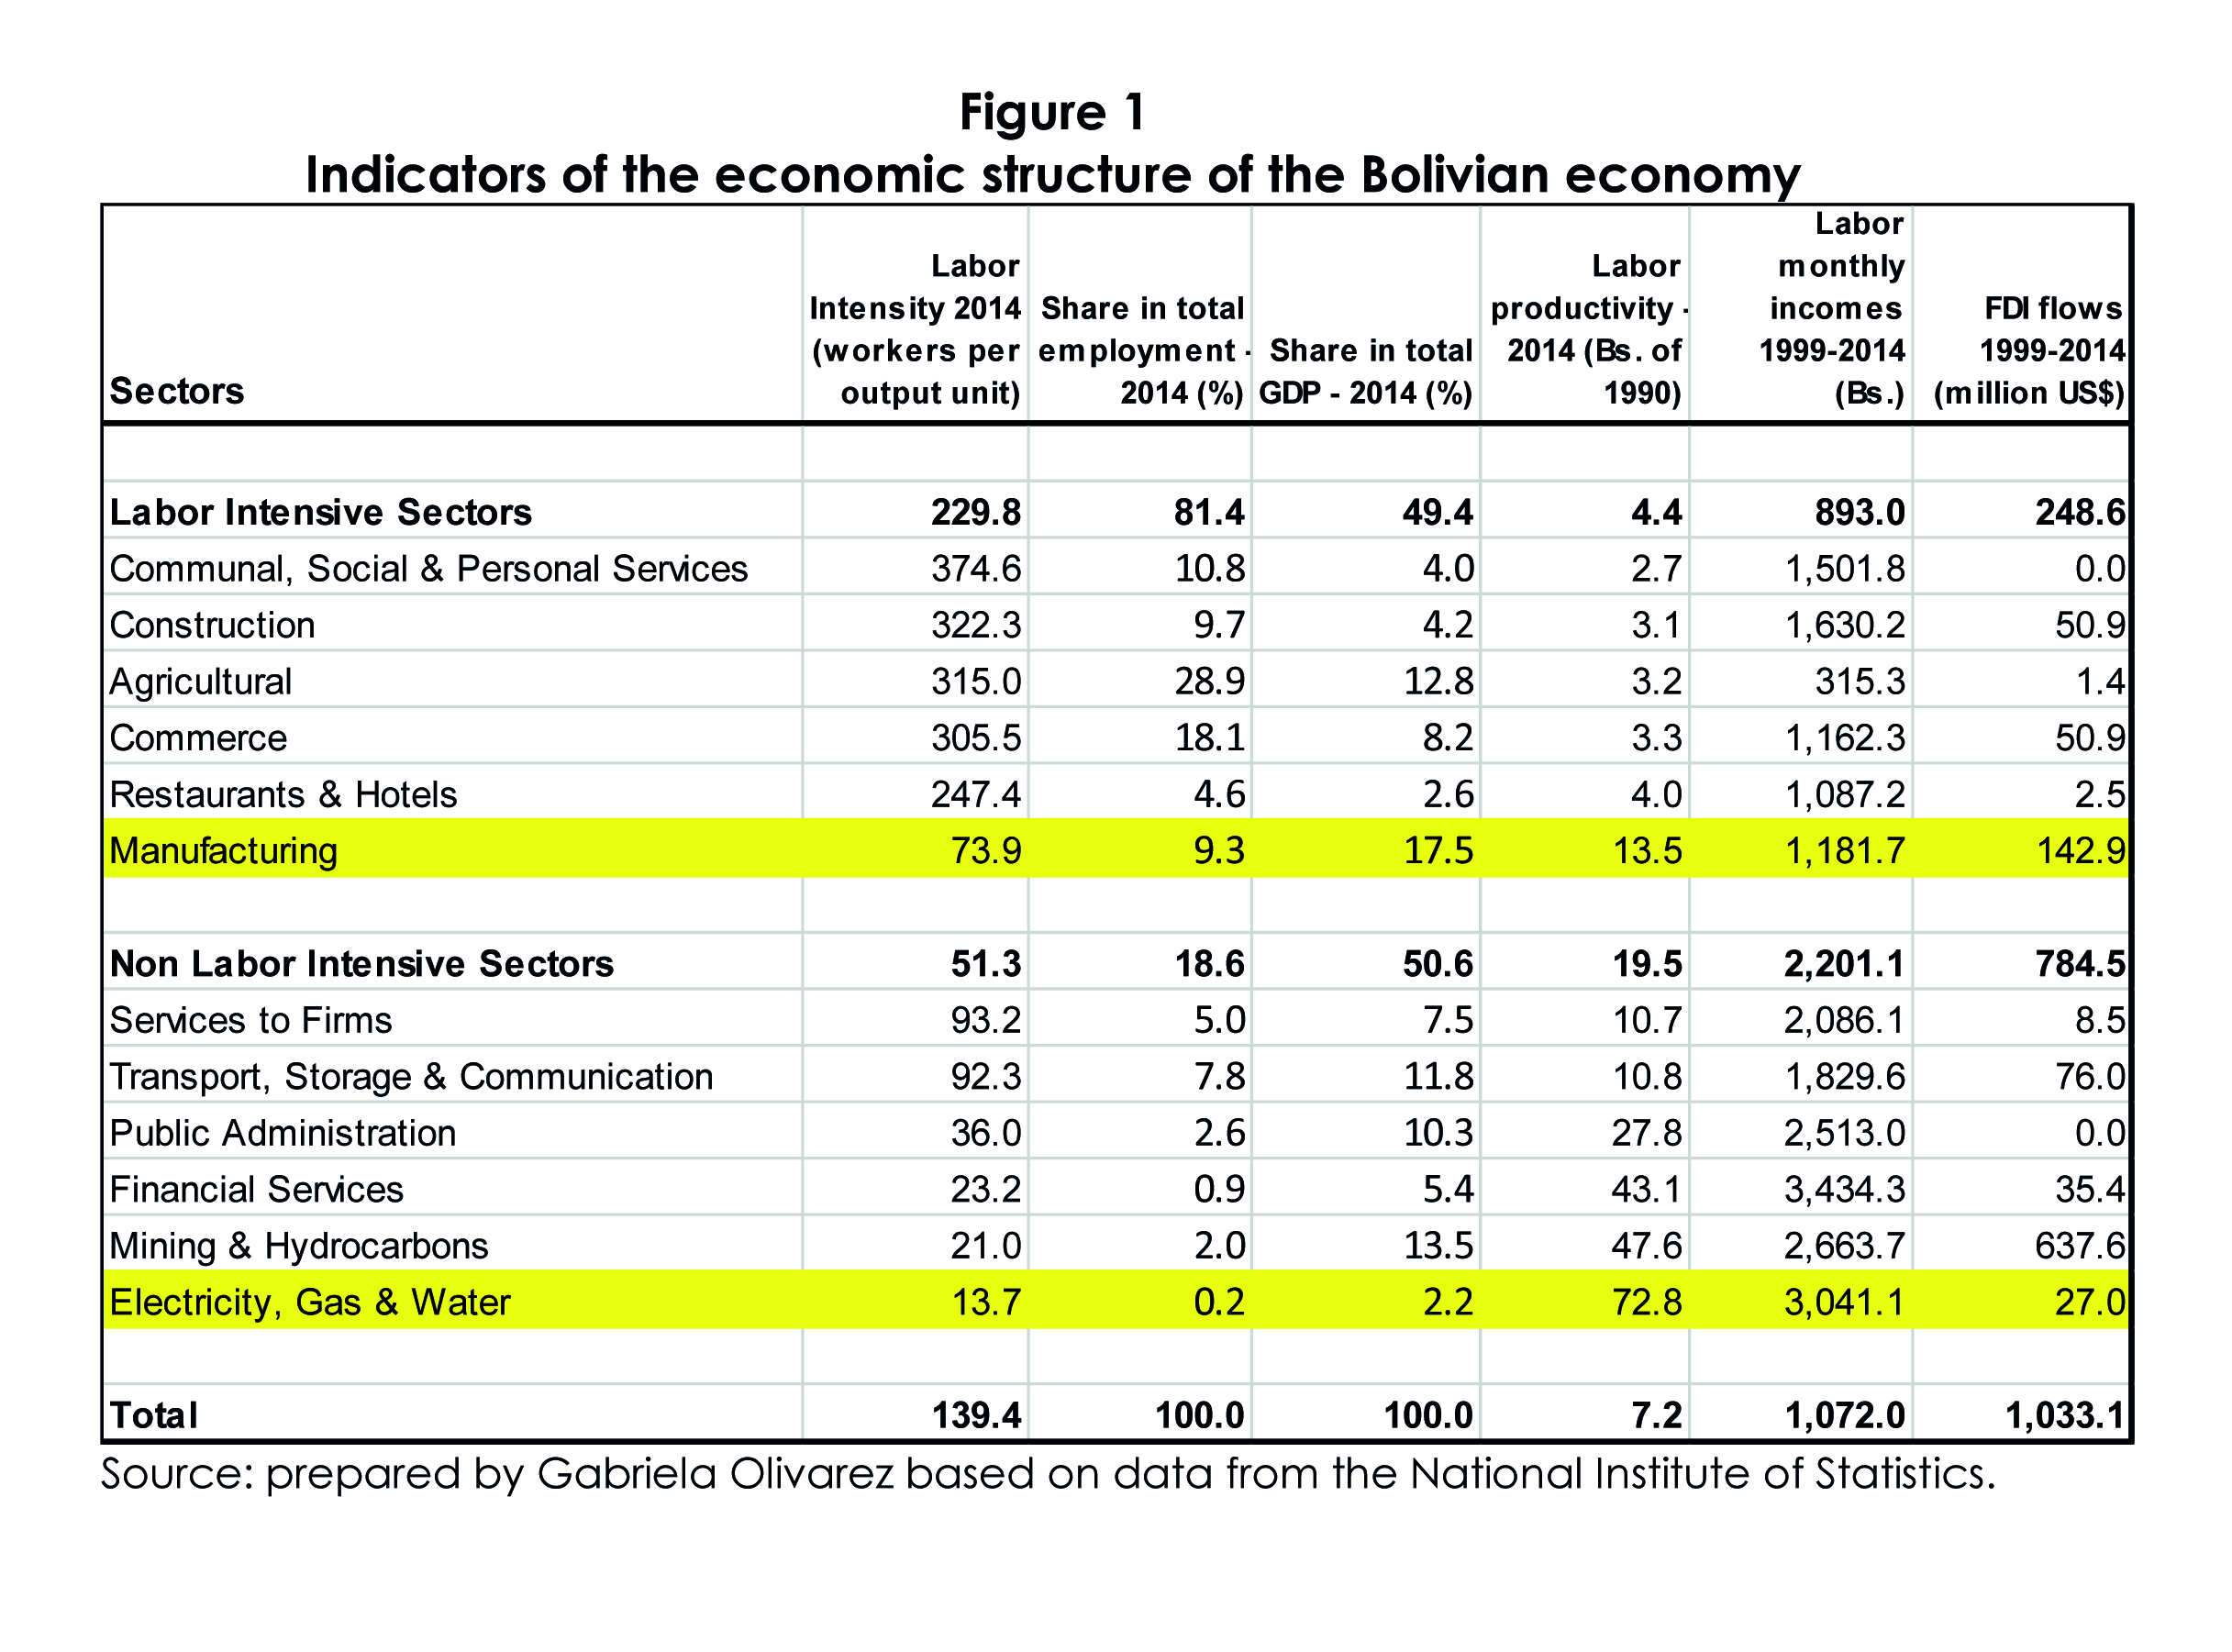 Figure 1 shows that in 2014, 49.4% of GDP was concentrated in labor-intensive activities, while 50.6% in non labor-intensive activities. Employment, on the other hand, was largely concentrated on labor-intensive activities, which comprised 81.4% of total employment, while non labor-intensive activities only comprised 18.6% of the occupied population. These GDP and labor structures imply large productivity gaps between the two sector groups, being the average productivity in non labor-intensive sectors 4.5 times larger than that in labor intensive sectors. The productivity gap in turn brought about labor income disparities, with workers employed in non labor-intensive activities earning 2.5 more than those in labor-intensive sectors.